What Are Subplots in Matplotlib?
Subplots in Matplotlib allow you to display multiple charts inside a single figure window.
This is useful when you want to compare datasets, show different visualizations together, or create dashboards.
Instead of opening many separate windows, subplots organize charts in a grid layout.
Using plt.subplot()
The subplot() function divides the figure into rows and columns.
Syntax:
Python
plt.subplot(rows, columns, index) -
rows → number of horizontal sections
-
columns → number of vertical sections
-
index → position of the current plot
Basic Subplot Example
Python
import matplotlib.pyplot as plt plt.subplot(1, 2, 1) plt.plot([1, 2, 3], [3, 2, 1]) plt.title("Plot 1") plt.subplot(1, 2, 2) plt.plot([1, 2, 3], [1, 2, 3]) plt.title("Plot 2") plt.show() # Output: # Two line charts displayed side by side 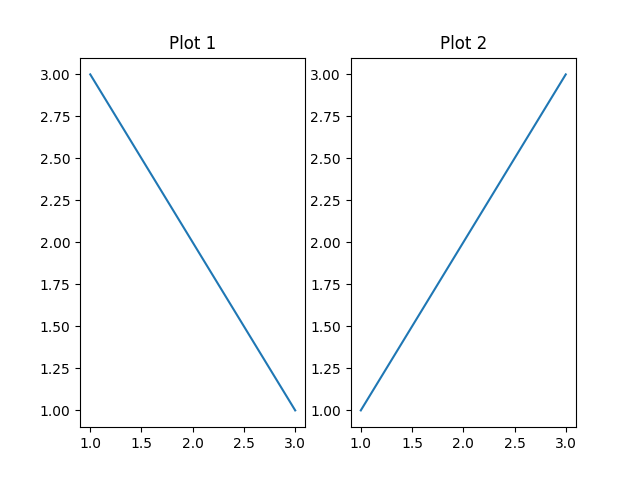
Using plt.subplots()
subplots() is a more flexible and recommended approach.
Python
import matplotlib.pyplot as plt fig, ax = plt.subplots(2, 1) ax[0].plot([1,2,3], [3,2,1]) ax[0].set_title("Top Chart") ax[1].plot([1,2,3], [1,2,3]) ax[1].set_title("Bottom Chart") plt.show() # Output: # Two stacked charts vertically 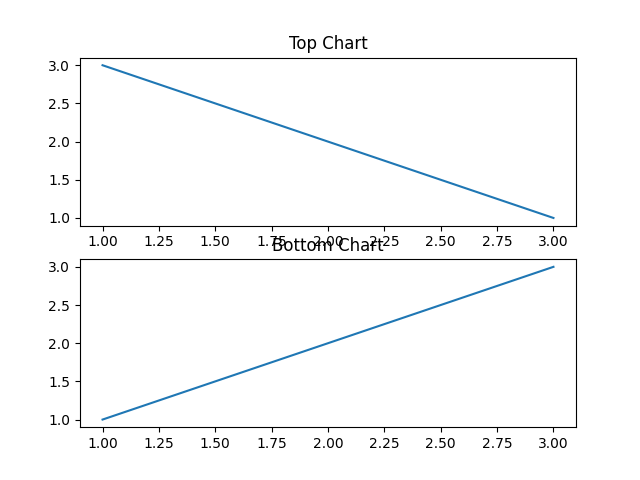
Combining Different Chart Types
Python
import matplotlib.pyplot as plt fig, ax = plt.subplots(1, 2) ax[0].bar(["A","B","C"], [5,7,3]) ax[0].set_title("Bar Chart") ax[1].scatter([1,2,3], [3,2,1]) ax[1].set_title("Scatter Plot") plt.show() # Output: # Bar chart and scatter plot side by side 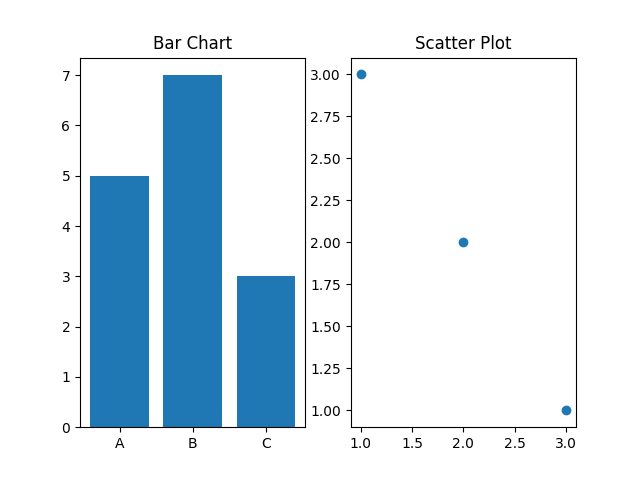
Why Use Subplots?
-
Compare multiple datasets easily
-
Save screen space
-
Build dashboards and reports
-
Improve data storytelling