What Is Matplotlib Pyplot?
Pyplot is a module in Matplotlib that provides a simple interface for creating graphs and charts in Python.
It works similarly to plotting tools in MATLAB and allows you to create visualizations with very few lines of code.
Pyplot is commonly imported as plt:
Python
import matplotlib.pyplot as pltWhy Use Pyplot?
Pyplot is widely used because it:
-
Is easy for beginners
-
Requires minimal code
-
Supports multiple chart types
-
Offers high customization
-
Works well with NumPy and Pandas
Basic Line Plot Example
Python
import matplotlib.pyplot as plt x = [1, 2, 3, 4] y = [10, 20, 15, 25] plt.plot(x, y) plt.show() # Output: # A simple line chart displaying data points connected by lines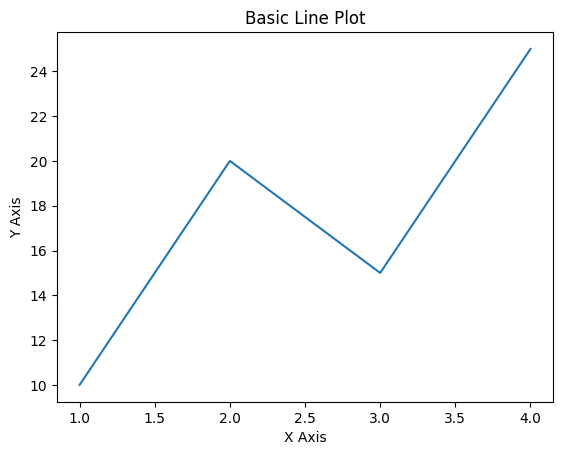
Adding Title and Labels
Python
import matplotlib.pyplot as plt x = [1, 2, 3, 4] y = [10, 20, 15, 25] plt.plot(x, y) plt.title("Sales Growth") plt.xlabel("Months") plt.ylabel("Revenue") plt.show() # Output: # Line chart with title and labeled axes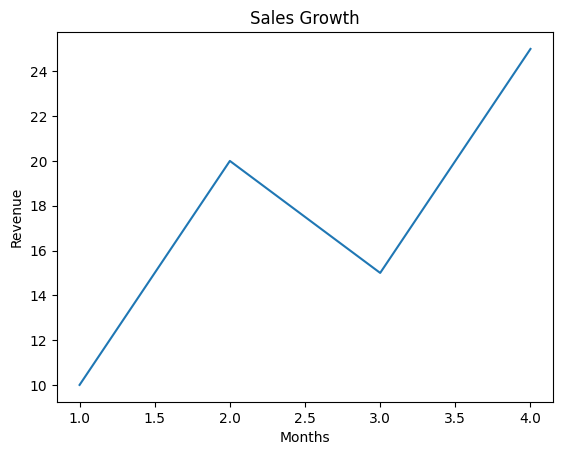
Creating a Bar Chart
Python
import matplotlib.pyplot as plt categories = ["A", "B", "C"] values = [5, 7, 3] plt.bar(categories, values) plt.show() # Output: # Bar chart comparing category values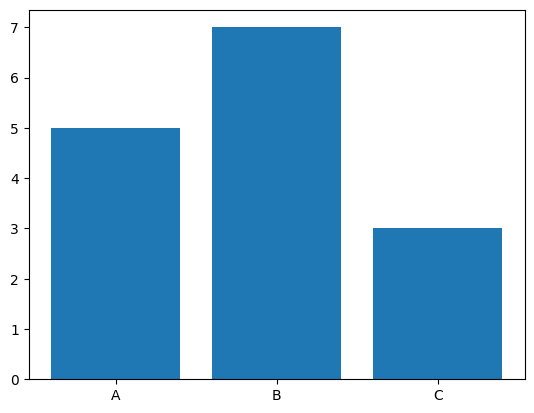
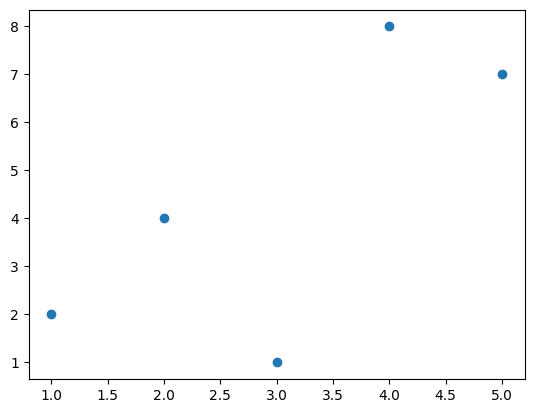
Creating a Scatter Plot
Python
import matplotlib.pyplot as plt x = [1, 2, 3, 4, 5] y = [2, 4, 1, 8, 7] plt.scatter(x, y) plt.show() # Output: # Scatter plot showing data point distribution