What Are Markers in Matplotlib?
Markers in Matplotlib are symbols used to highlight individual data points on a graph.
They make charts easier to read by clearly showing where each data value lies on the plot.
Markers are mainly used in line plots and scatter plots.
Basic Marker Example
Python
import matplotlib.pyplot as plt x = [1, 2, 3, 4] y = [10, 15, 20, 25] plt.plot(x, y, marker="o") plt.show() # Output: # Line chart with circular markers on each point 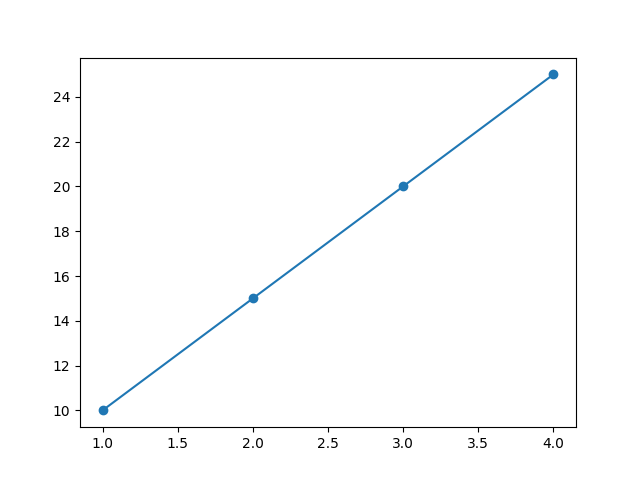
Here, "o" represents a circle marker.
Common Marker Styles
| Marker | Symbol | Description |
|---|---|---|
"o" | ● | Circle |
"s" | ■ | Square |
"^" | ▲ | Triangle Up |
"v" | ▼ | Triangle Down |
"*" | ★ | Star |
"+" | + | Plus |
"x" | × | Cross |
"D" | ◆ | Diamond |
Changing Marker Size
Python
import matplotlib.pyplot as plt x = [1, 2, 3, 4] y = [10, 15, 20, 25] plt.plot(x, y, marker="o", markersize=10) plt.show() # Output: # Plot with larger circle markers 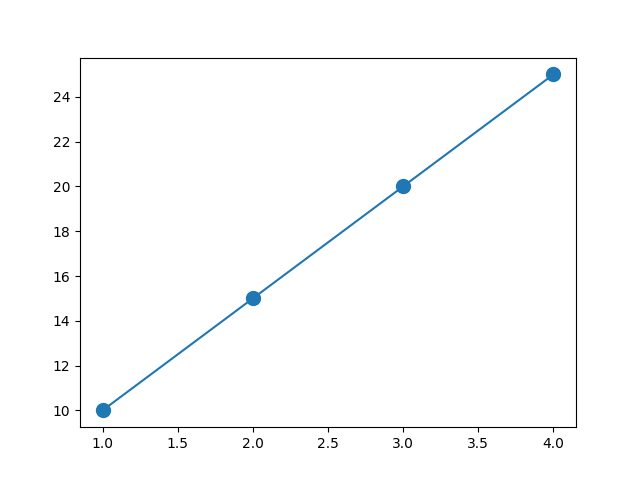
markersize controls how big the marker appears.
Changing Marker Color
Python
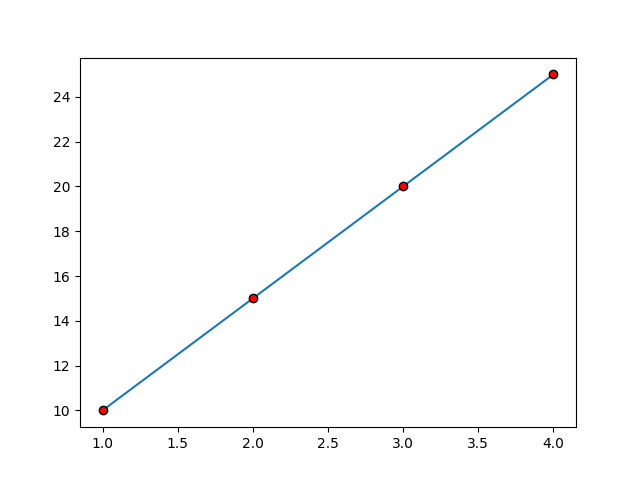
import matplotlib.pyplot as plt x = [1, 2, 3, 4] y = [10, 15, 20, 25] plt.plot(x, y, marker="o", markerfacecolor="red", markeredgecolor="black") plt.show() # Output: # Red markers with black borders -
markerfacecolor→ inner color -
markeredgecolor→ border color
Using Markers Without Lines
Python
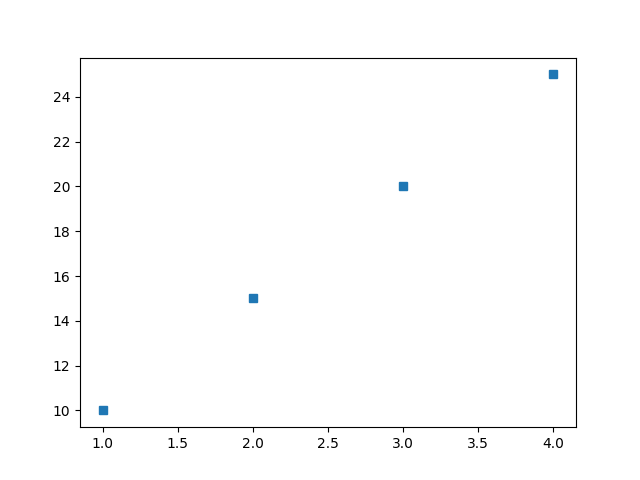
import matplotlib.pyplot as plt x = [1, 2, 3, 4] y = [10, 15, 20, 25] plt.plot(x, y, linestyle="", marker="s") plt.show() # Output: # Only square markers displayed without connecting lines This is useful when you want a scatter-style look.
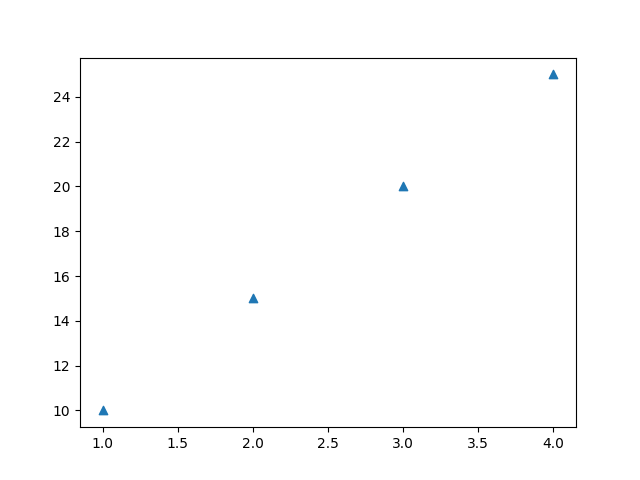
Markers in Scatter Plot
Python
import matplotlib.pyplot as plt x = [1, 2, 3, 4] y = [10, 15, 20, 25] plt.scatter(x, y, marker="^") plt.show() # Output: # Scatter plot with triangle markers Scatter plots often use markers to represent each data point.
Combining Marker with Line Style
Python
import matplotlib.pyplot as plt x = [1, 2, 3, 4] y = [10, 15, 20, 25] plt.plot(x, y, marker="*", linestyle="--", color="blue") plt.show() # Output: # Dashed blue line with star markers 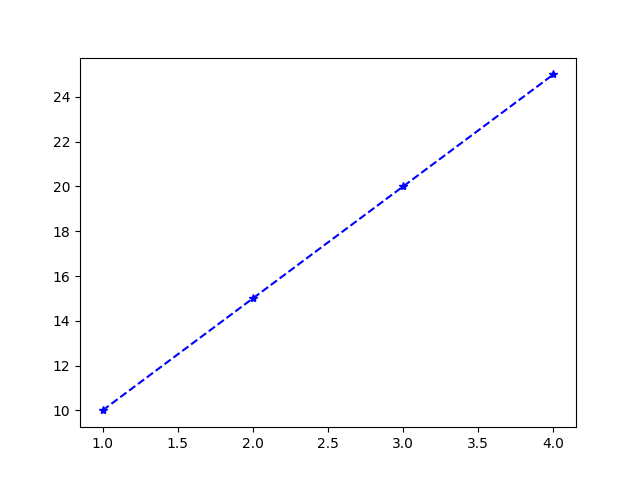
Key Points to Remember
-
Markers improve data visibility.
-
Use
markerparameter insideplot()orscatter(). -
Customize size using
markersize. -
Change colors using
markerfacecolorandmarkeredgecolor. -
Combine with line styles for better visualization.