What Is Plotting in Matplotlib?
Plotting in Matplotlib refers to creating visual representations of data such as graphs and charts. Plotting helps in understanding patterns, trends, and relationships in data quickly and clearly.
Matplotlib provides a powerful module called pyplot that makes plotting simple and efficient.
Importing Matplotlib Pyplot
Python
import matplotlib.pyplot as plt plt is the commonly used alias for the pyplot module.
1. Line Plot
A line plot is used to show trends over time or continuous data.
Python
import matplotlib.pyplot as plt x = [1, 2, 3, 4] y = [10, 15, 20, 25] plt.plot(x, y) plt.show() # Output: # Line graph connecting the points 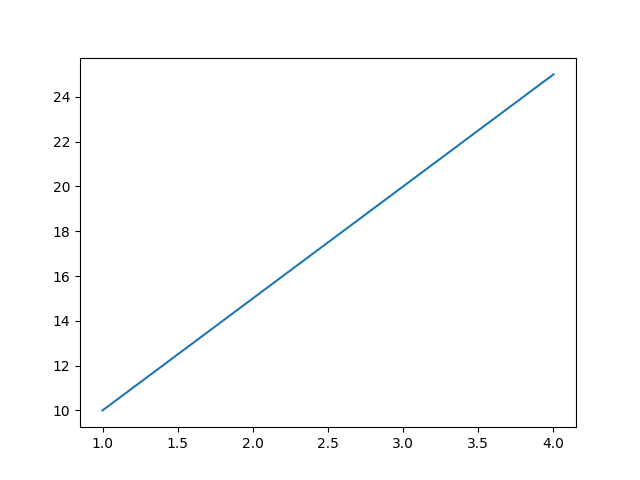
2. Bar Chart
A bar chart compares different categories.
Python
import matplotlib.pyplot as plt categories = ["A", "B", "C"] values = [5, 7, 3] plt.bar(categories, values) plt.show() # Output: # Bar chart with three bars 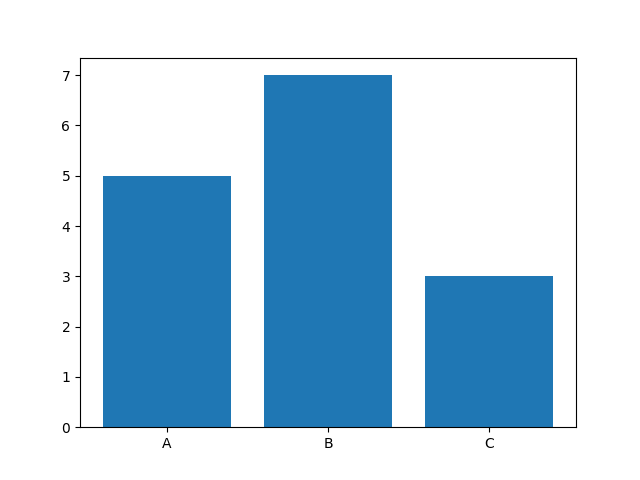
3. Scatter Plot
A scatter plot shows relationships between two variables.
Python
import matplotlib.pyplot as plt x = [1, 2, 3, 4, 5] y = [2, 3, 5, 7, 11] plt.scatter(x, y) plt.show() # Output: # Points scattered across the graph 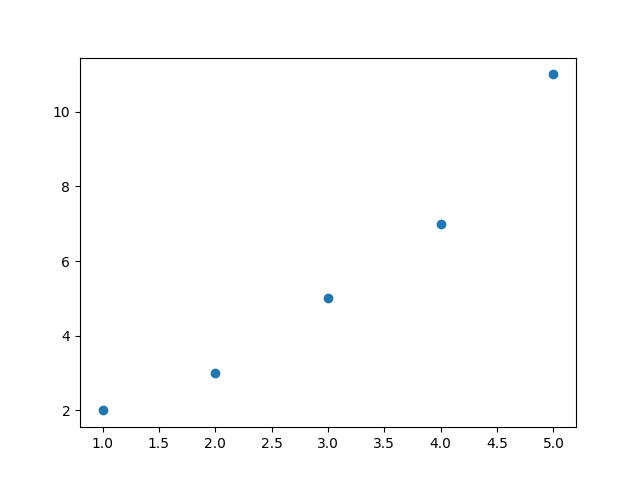
4. Histogram
A histogram shows data distribution.
Python
import matplotlib.pyplot as plt data = [1,2,2,3,3,3,4,4,5] plt.hist(data) plt.show() # Output: # Histogram displaying frequency distribution 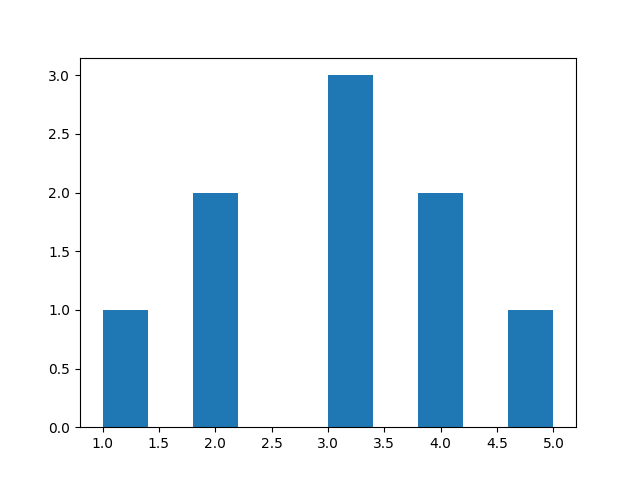
5. Pie Chart
A pie chart shows proportions.
Python
import matplotlib.pyplot as plt sizes = [40, 30, 20, 10] labels = ["A", "B", "C", "D"] plt.pie(sizes, labels=labels) plt.show() # Output: # Circular pie chart with segments 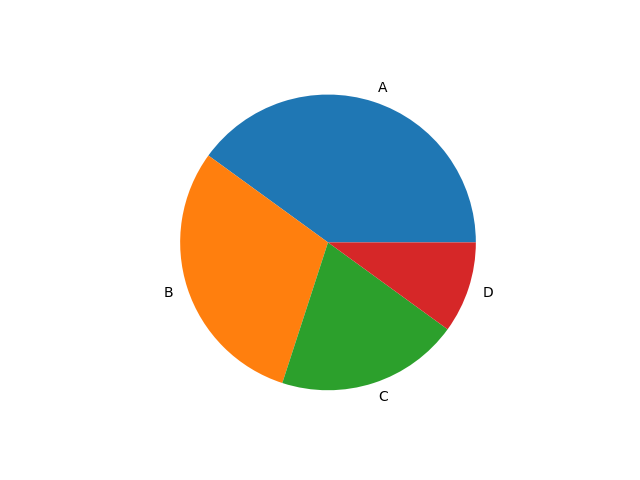
Customizing Plots
You can enhance visuals by adding titles, labels, and styles.
Python
import matplotlib.pyplot as plt x = [1, 2, 3, 4, 5] y = [2, 3, 5, 7, 11] plt.plot(x, y, color="blue", linestyle="--", marker="o") plt.title("Sample Chart") plt.xlabel("X Axis") plt.ylabel("Y Axis") plt.show() # Output: # Styled line graph with title and labels 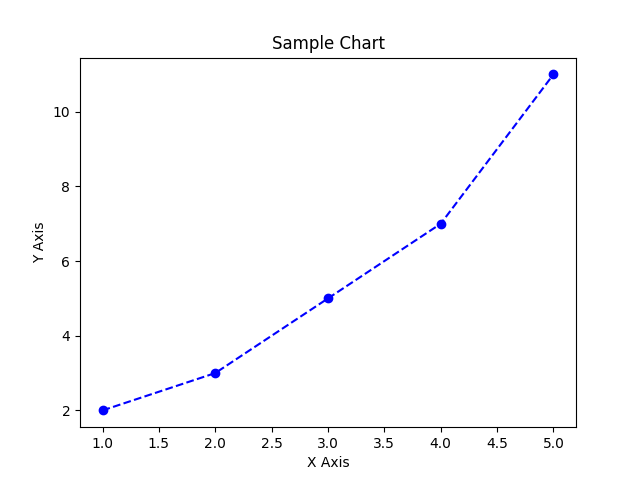
Multiple Plots (Subplots)
Python
import matplotlib.pyplot as plt plt.subplot(1, 2, 1) plt.plot([1,2,3], [3,2,1]) plt.subplot(1, 2, 2) plt.plot([1,2,3], [1,2,3]) plt.show() # Output: # Two charts side by side 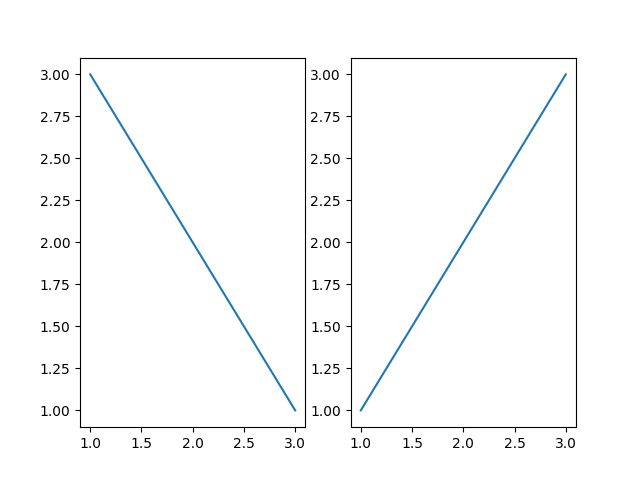
Common Plotting Functions
| Function | Purpose |
|---|---|
plot() | Line graph |
bar() | Bar chart |
scatter() | Scatter plot |
hist() | Histogram |
pie() | Pie chart |
subplot() | Multiple plots |
title() | Add title |
xlabel() / ylabel() | Axis labels |
show() | Display chart |