What Is Grid in Matplotlib?
A grid in Matplotlib is a set of horizontal and vertical lines displayed on a chart to make data easier to read and interpret.
Grid lines help viewers compare values, align points with axes, and understand scale clearly.
Grids are commonly used in line charts, bar charts, and scatter plots.
Basic Grid Example
Python
import matplotlib.pyplot as plt x = [1, 2, 3, 4] y = [10, 20, 15, 25] plt.plot(x, y) plt.grid() plt.show() # Output: # Line chart with default grid lines 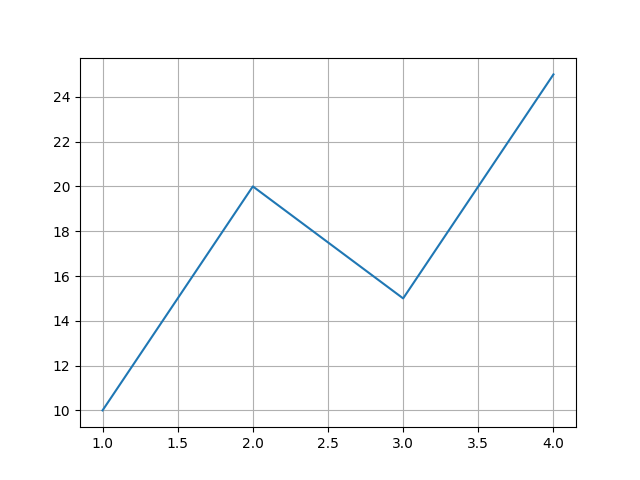
Turning Grid On or Off
Python
import matplotlib.pyplot as plt x = [1, 2, 3, 4] y = [10, 20, 15, 25] plt.plot(x, y) plt.grid(True) # Turn ON plt.grid(False) # Turn OFF plt.show() # Output: # Grid enabled or disabled 
Changing Grid Line Style
Python
import matplotlib.pyplot as plt x = [1, 2, 3, 4] y = [10, 20, 15, 25] plt.plot(x, y) plt.grid(linestyle="--") plt.show() # Output: # Chart with dashed grid lines 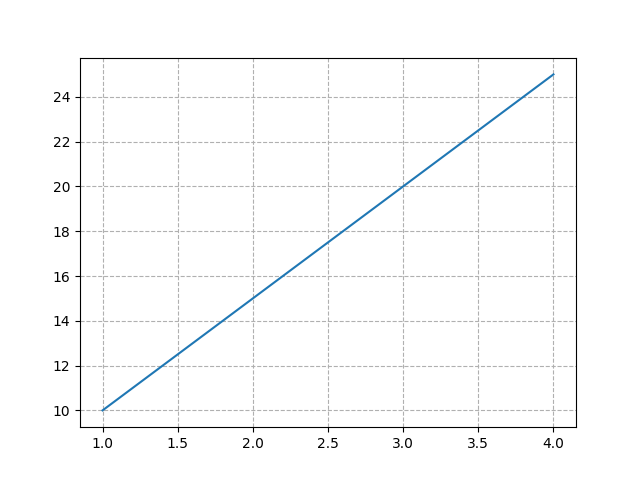
Common Line Styles
| Style | Description |
|---|---|
"-" | Solid line |
"--" | Dashed line |
":" | Dotted line |
"-." | Dash-dot line |
Changing Grid Color and Width
Python
import matplotlib.pyplot as plt x = [1, 2, 3, 4] y = [10, 20, 15, 25] plt.plot(x, y) plt.grid(color="gray", linewidth=1) plt.show() # Output: # Gray grid lines with custom thickness 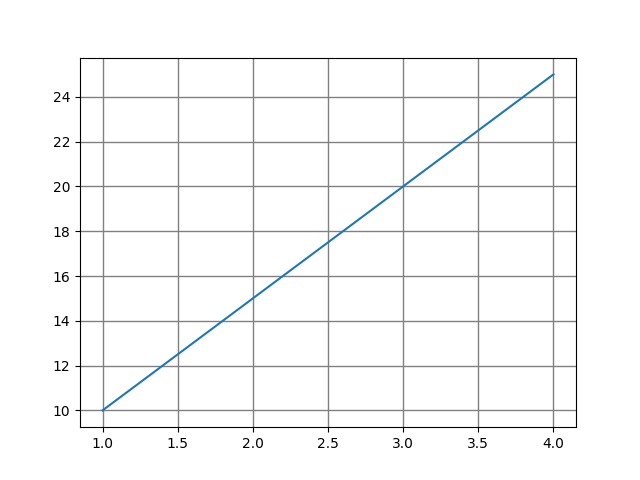
Grid for Specific Axis
Python
import matplotlib.pyplot as plt x = [1, 2, 3, 4] y = [10, 20, 15, 25] plt.plot(x, y) plt.grid(axis="x") # Only vertical grid plt.show() # Output: # Grid lines only on X-axis 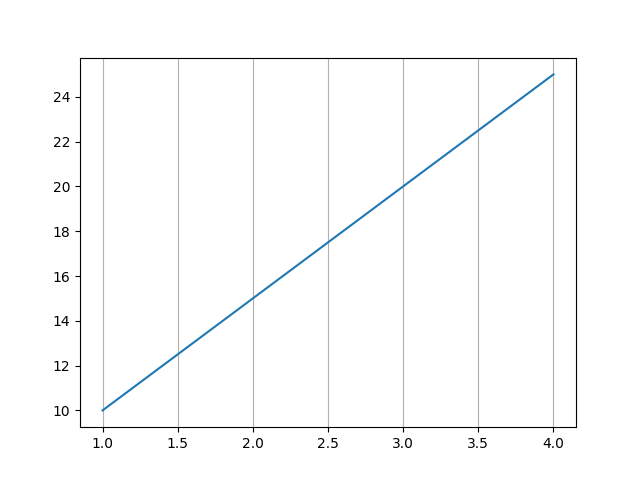
Combining Customizations
Python
import matplotlib.pyplot as plt x = [1, 2, 3, 4] y = [10, 20, 15, 25] plt.plot(x, y) plt.grid(color="blue", linestyle=":", linewidth=0.8) plt.show() # Output: # Blue dotted grid lines 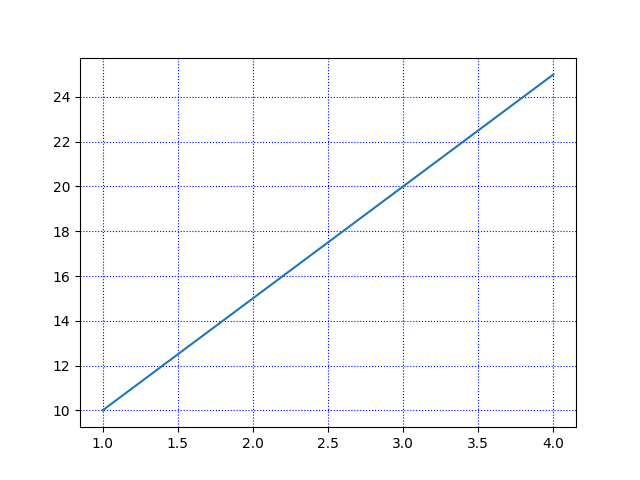
Why Use Grid Lines?
-
Improve data readability
-
Help align data points
-
Enhance presentation quality
-
Useful for precise comparison of values